What I love most about working at a start-up is the freedom of trial and error. We constantly change the look and feel of the data we present to make a better user experience. With some recent feedback from some of our users (as well as the realization that some of our important data is far too hidden), we’ve spent the last week working on increasing the value of our reports, which means increasing readability as well as page load time.
Most of our reports follow a pretty simple structure; a summary report with high level data coupled with a detail report of the raw data. We’ve realized that our detail reports weren’t scaling very well. If there are more than 50 items with details, not only was the functionality not right, but the load time of the report was suffering.
The Issue
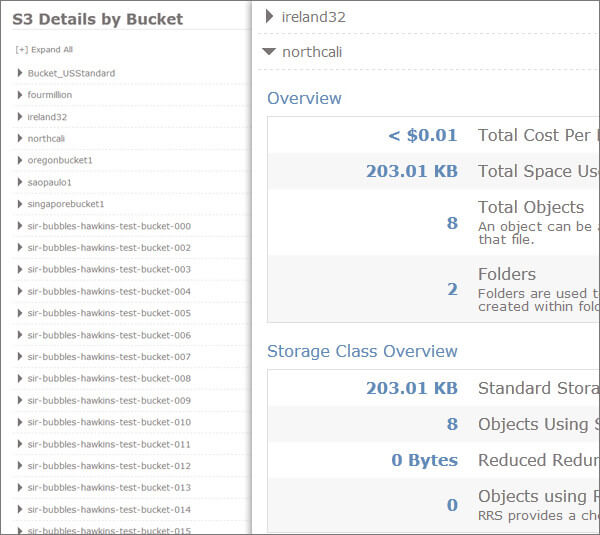
For this post we’ll dig into our S3 reports. The screenshot below shows an example of the old reports.

The left of the image illustrates the display for each bucket, and the right side illustrates the details we show when you click an individual bucket. This functionality works fine for a handful of buckets, but when we get up to 50+ buckets it begins to fail.
For starters the functionality doesn’t work well with a lot of buckets. It’s far too much data to look at with no real value. Simply looking at a bucket name and the region it belongs too isn’t very insightful. Coupled with this is the load time; an S3 detail report with around 100 buckets took around 18 seconds to load.
The Solution
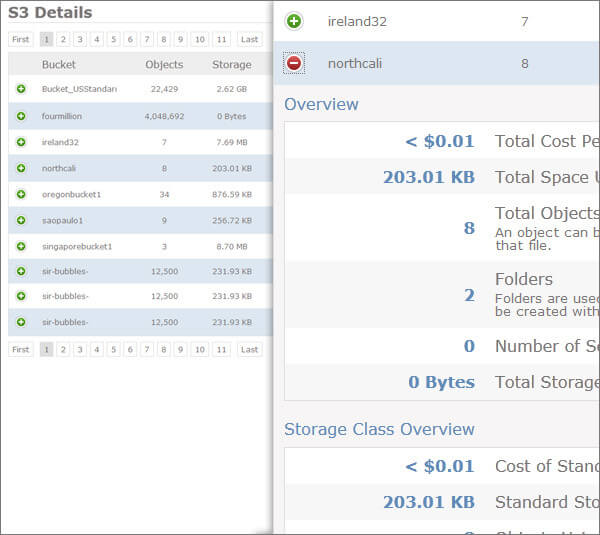
We solved our issues in two steps. The first was to alter our display to a grid model and add key values to the display of each bucket. For our S3 detail report we added object count, total storage used, and estimated cost per month. Now we have key indicators displayed to help our users find the important buckets to see details for.
The second step was to solve the load time. We spent a day investigating our bottle necks and found that returning the data took under 1 second. However, our application uses MVC3 and we render each detail section as a partial view when the page loads. That’s a lot of work for the page to do. The solution was to paginate the data so there was less work to do on page load. Paginating to 10 results per page reduced our load time to just 3.4 seconds.

Conclusion
Our detail reports are looking pretty slick now. With a grid model we were able to show high level statistics for individual items, making the report easily readable with a quick scan down the page. We are working hard to get the new functionality to our production environment so be on the look out over the next week. The new report format will only be in the S3 Detail, EC2 Detail, and the Billing Detail reports but the others will be converted next week.
See CloudCheckr in action: schedule a demo.
Cloud Resources Delivered
Get free cloud resources delivered to your inbox. Sign up for our newsletter.
Cloud Resources Delivered
Subscribe to our newsletter
