You’ve been using public cloud for some time. But are you getting the most out of it? One way to know for sure is to pay attention to metrics around cloud utilization and memory. Understanding the impact of memory metrics can help you right size cloud resources and save money on your cloud bill.
First, let’s explore some basic terms. What do we mean by cloud metrics, memory metrics, and right sizing?
What are cloud metrics?
Cloud metrics are data points around the efficiency, security, and cost-effectiveness of your cloud environment and its operations. Typically, a cloud platform gathers these metrics in real-time. You can then use the data to generate reports that show your overall cloud performance. Examining cloud metrics data can show you resource utilization, any latencies or errors that have occurred, and cloud cost trends.
What are memory metrics?
In the cloud, memory metrics refer to the utilization of memory in the cloud. As with a server or desktop computer, the more cloud applications you have running, the more memory you’re using. Cloud memory metrics may be displayed in reports as a percentage of memory or number of bytes used.
Why look at cloud metrics?
Organizations that practice continuous operations need to ensure that they use resources efficiently and minimize downtime. Monitoring memory usage can clue you in to where there may be problems or performance bottlenecks in your infrastructure, especially in large, high-performance databases and in-memory applications.
Reviewing cloud metrics and data on a regular basis helps you to find and fix issues when they occur — not at the end of the month when the cloud bill arrives. For example, a common cost issue in cloud computing includes resources that are spun up but not turned off. Cloud metrics can tell you which cloud services are in use, what they cost, and where you can save money — often through removing resources that you no longer need. This process is known as right sizing.

What is right sizing?
Right sizing in cloud computing is one of the most powerful ways to optimize cloud spend for maximum performance. This process identifies unused or idle instances and turns them off, as well as finding overprovisioned instances and reducing their size to meet your current resource needs. Looking at this data on a regular basis helps organizations use the right compute resources and save money on their cloud bills.
With the right metrics, you can see which services are most in use and, conversely, which resources are no longer running. In order to maximize efficiency, you need a deeper dive into cloud performance. This means reviewing how much memory your resources are using.
How do you monitor memory metrics?
Native cloud tools can provide you with an overview of your cloud metrics. In AWS, you can monitor key cloud metrics through CloudWatch. (Microsoft Azure offers similar functionality in Application Insights, and Google Cloud metrics can be found under Cloud Monitoring.) However, while CloudWatch enables you to get a view of your overall cloud performance, you’ll need to use CloudWatch Metrics to gain insights into your memory utilization.
You can also use third-party cloud management tools to find and report on key metrics. CloudCheckr makes right sizing easier by providing all of these metrics in a single dashboard. This is especially useful for organizations that have multiple accounts and/or use multiple cloud platforms. In CloudCheckr, you can look at how much you can save and where you can optimize resources and have that information in a single location for all accounts and clouds.
How do you right size with memory metrics in CloudCheckr?
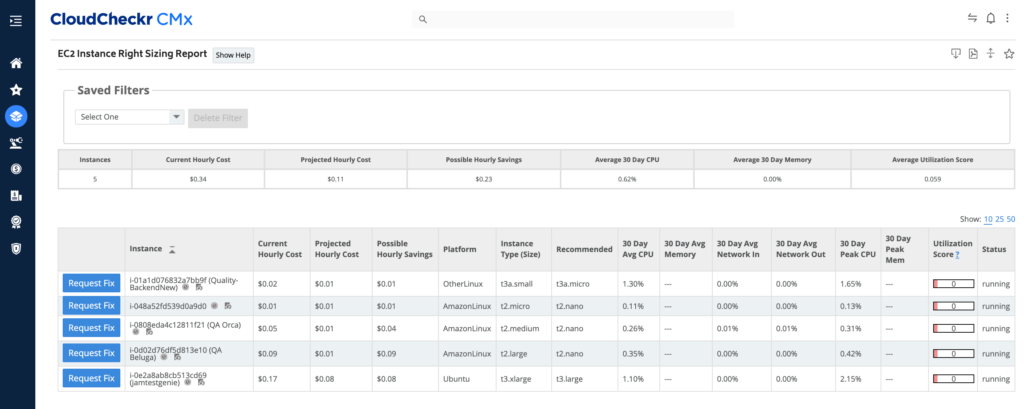
CloudCheckr offers right sizing reports that can recommend scaling compute instance sizes up or down — as well as suggesting different types of instances. CloudCheckr makes these recommendations based on a number of parameters, including CPU utilization and network I/O. This is possible without installing an agent on each computing instance.
This agentless approach is desirable and sufficient for most customers. There is no need to download, install, and maintain another piece of software on your servers. Additionally, there is no unnecessary software draining your CPU cycles.
While recording memory metrics would require an agent, customers who are experiencing high memory utilization are likely also maxing out their CPUs, so right sizing recommendations can still be reliable without an agent. But for those customers that prefer including memory metrics, CloudCheckr has a couple of options.
AWS agent option
Amazon Web Services (AWS) offers the Amazon CloudWatch Agent as an option for EC2 instances running Linux or Windows Server. The CloudWatch Agent can measure custom metrics, including memory utilization, and the data is stored in CloudWatch Metrics. There are additional Custom Metric fees for CloudWatch beyond the basic services.
First, install the CloudWatch Agent on each EC2 instance that you wish to measure, using these instructions. Note that instances running older versions of Linux or Windows Server, particularly older Amazon Machine Image (AMI) instances may not support the current CloudWatch Agent. Additionally, the administrator needs to create IAM roles and users that the CloudWatch Agent runs as, with permissions to monitor and log the desired metrics.
Once you have enabled CloudWatch custom metrics on your AWS account, you need to follow these directions to synchronize the data with the CloudCheckr app. You will need to add a custom CWAgent metric. In Linux, the metric name is system_mem_utilization and in Microsoft Windows, it is Bytes Per Second.

Third-party agent option
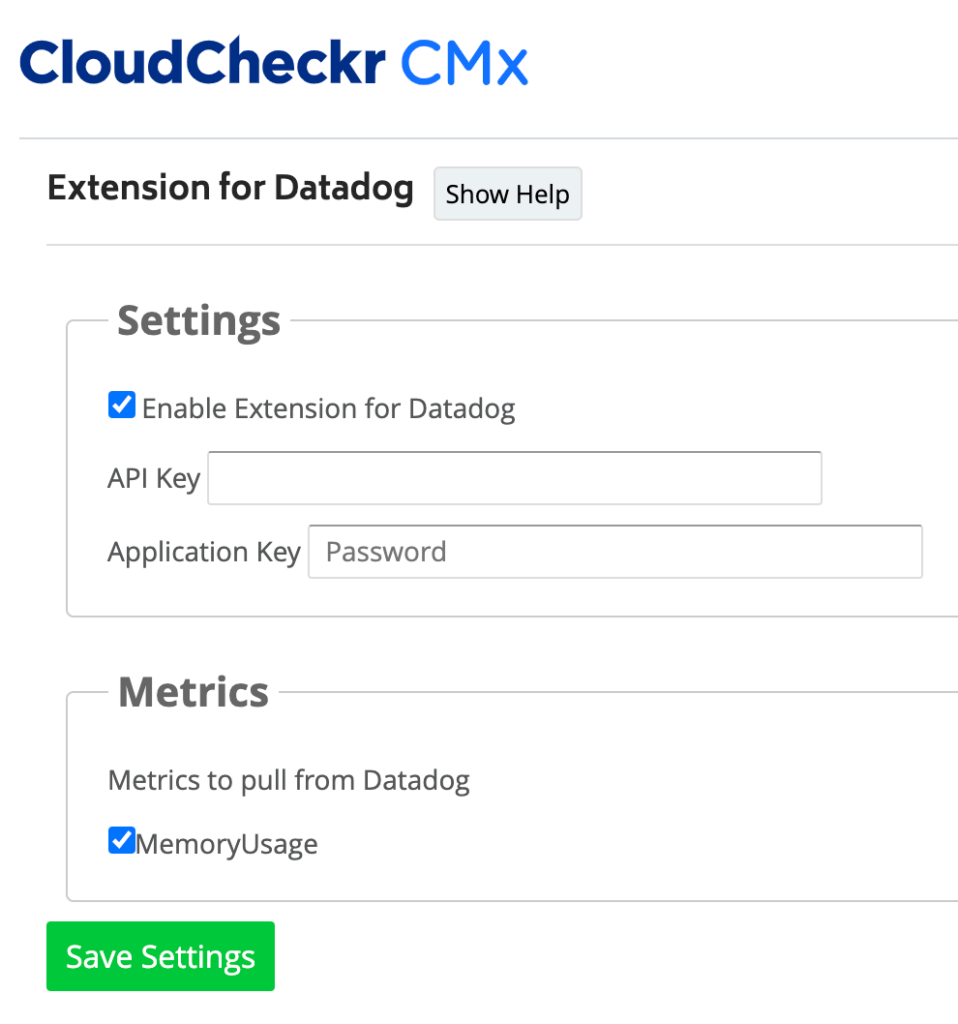
There is another option for logging memory utilization, from a third-party. CloudCheckr recommends using Datadog, a cloud-based performance monitoring tool. The Datadog agent will need to be installed on each applicable computing instance, and configured to report memory utilization to CloudCheckr. The Datadog integration can be managed within the Account Configuration > Integrations menu in CloudCheckr CMx. In order to use the integration, you will need to provide your Datadog API and Application Keys.
Make right sizing easier with cloud metrics
Users can integrate memory utilization metrics into the CloudCheckr right sizing report, if needed. You can find this in CloudCheckr CMx in the Resources menu. Understand the pros and cons of adding an agent, either from AWS or a third-party, and you can enjoy even more precise recommendations.
Want Total Visibility into your cloud spend, security, and resources? Get a free Cloud Check Up.
Cloud Resources Delivered
Get free cloud resources delivered to your inbox. Sign up for our newsletter.
Cloud Resources Delivered
Subscribe to our newsletter

